1
Nov
tChart
Author: rberthou
Description
tChart is a Chart Applet. The applet’s size is very small (14Ko…25Ko). tChart runs on all browsers with JDK 1.1 support (or greater).
tChart is a simple sample of my cChart Component. With tChart you can draw : Bars, lines, pies, data tables, Area…
Download
tChart.zip
News V5.31
Version V 5.31
- Correct a small bug (when all values < 0)
Version 5.30
- add new presentation mode (point mode “8″)
- Can change color in line
- restore bgimg option and add center right and mosaic options
- add javascript’s functions
- and more….
Version 5.20
- Rotate Texte in label and Ox axe
- add tChart4 with auto-refresh
- can change origine position
- can change all font
- add public method to addRow in javascript
- change presentation in line and NAN value
Enregistrement
tChart is FreeWare for non commercial sites.
For personal use, please add a link on your site back to my Home Page (http://www.javaside.com/) and send me the URL where you wish to place the tChart applet.
For professional / commercial use, you will need to obtain a “professional registration”. With this registration you can use tChart with no reference to me and I will send you the complete tChart and cChart source.
If you want to use cChart in another Applet or application, then you must obtain a “professionnal registration”.
For more information about “Professional registration” :
HTML Source
<applet code="tchart.class" width=550 height=380>
   <param name=bgImg value="./f_2.gif">
   <param name=font value="Dialog,0,8">
   <param name=fontL value="Arial,1,14">
   <param name=fontT value="Arial,3,16">
   <param name=origine value="50,80">
   <param name=bgcolor value=14737632>
   <param name=frame value=25>
</applet>
Parameters
| Name |
Type |
Description |
| csep |
char |
char separator (default ‘;’) |
| file |
string |
File (with link to data file) use “./” for relative URL (default file.txt) |
| actif |
integer |
number of actif data file (default 0) |
| bgImg |
string |
Name of background image |
| cbg |
char |
background disposition R / L / M / C |
| bgcolor |
integer |
Border color rrggbb info (#FFFFFF) |
| lgcolor |
integer |
Line color rrggbb info (#FFFFFF) |
| font |
text |
Font bullet definition format : “name,style,size” |
| fontT |
text |
Font Title definition format : “name,style,size” |
| fontL |
text |
Font Legend definition format : “name,style,size” |
| origine |
text |
origine position format : “X,Y” default “40,40″ |
| rotate |
char |
Rotate text and legend option (default “Y”) |
| frame |
integer |
Size of 2 canvas (if not define no 2 canvas) |
File Liste Format
| Colum |
Name |
Type |
Description |
| “*” => mandatory / obligatoire |
| 1* |
Title |
String |
Title of data file |
| 2* |
NumCol |
Integer |
Number of column in data file |
| 3* |
DataFile |
String |
URL of Data file |
| 4* |
Style |
Integer |
Presentation style
- 0 : Bar
- 1 : Line
- 2 : Pie
- 3 : SumBar
- 4 : Table
- 5 : Line Area
- 6 : Sum Line Area
- 7 : Mode point
- 8 : Mode point simple
|
| 5 |
ExtStyle |
Integer |
Extended style
- 0 – Bullet and Presentation (Default)
- 1 – No bullet / presenation
- 2 – Bullet / No presentation
- 3 – No bullet / No presentation
- 10 – bullet (in graph) / Pas presentation
- 11 – gestion sourie / Pas presentation
- 12 – bullet (in graph) / presentation
- 13 – gestion sourie / presentation
|
| 6 |
hscale |
Integer |
Number of item display Without horizotal scroll (default 0 => all) |
| 7 |
Min |
Double |
Force min value |
| 8 |
Max |
Double |
Force max value |
| all |
unit |
String |
format unit=dddddd:sssss change unit with ddddd=double unit conversion and sssss string unit (kb, cm, …) |
| frm |
String |
Decimal presentation format (Use java format) sample “#,##0.00″ |
| ilg |
int |
number of mark on Ox axis. If ilg=5 cChart display 1 legend for 5 data
WARNING !! if ilg=-5 cChart display 5 legends |
|
; name ; nbcol ; file ; pres ; pres2 ; nbval ; Min ; Max
Kake ; 3 ; ./txt/test.txt ; 2 ; 10
Test 0 iY ; 1 ; ./txt/m_0.txt ; 0 ; 1 ; ; ;
Test 1 Bar ; 1 ; ./txt/m_0197.txt ; 0 ; 11 ; 5 ; 22 ; 150 ;
Test 1 Aire ; 1 ; ./txt/m_0197.txt ; 5 ; 1 ; unit=2:zz
|
| Colum |
Name |
Type |
Description |
| “*” => mandatory / obligatoire |
| 1* |
Title |
String |
Title of data file |
| 2* |
NumCol |
Integer |
Number of column in data file |
| 3* |
DataFile |
String |
URL of Data file |
| 4* |
Style |
Integer |
Presentation style
- 0 : Bar
- 1 : Line
- 2 : Pie
- 3 : SumBar
- 4 : Table
- 5 : Line Area
- 6 : Sum Line Area
- 7 : Mode Point
- 8 : Mode point simple
|
| 5* |
ExtStyle |
Integer |
Extended style
- 0 – Bullet and Presentation (Default)
- 1 – No bullet / presenation
- 2 – Bullet / No presentation
- 3 – No bullet / No presentation
- 10 – bullet (in graph) / No presentation
- 11 – gestion sourie / Pas presentation
- 12 – bullet (in graph) / presentation
- 13 – gestion sourie / presentation
|
| 6* |
Font Name |
String |
Font Name |
| 7* |
Font Size |
Integer |
Font Size |
| 8* |
BGColor |
Integer |
Background color (in decimal) |
| 9* |
xPosition |
Integer |
Position left |
| 10* |
yPosition |
Integer |
Position top |
| 11* |
Width |
Integer |
Size width |
| 12* |
Height |
Integer |
Size Height |
| 13 |
hscale |
Integer |
Number of item display Without horizotal scroll |
| 14 |
Min |
Double |
Force min value |
| 15 |
Max |
Double |
Force max value |
| last |
bg Image |
String |
Back ground image |
| all |
unit |
String |
format unit=dddddd:sssss change unit with ddddd=double unit conversion and sssss string unit (kb, cm, …) |
| frm |
String |
ecimal presentation format (Use java format) sample “#,##0.00″ |
| ilg |
int |
number of mark on Ox axis. If ilg=5 cChart display 1 legend for 5 data
WARNING !! if ilg=-5 cChart display 5 legends |
|
;name ;ncol; file ; prs;prs2; font ;fsiz; bgcolor ; xPos; yPos;Width;Heigh;nval; Min ; Max
Tt A ; 1 ; ./m_07.txt ; 0 ; 1 ; Arial ; 10 ; 1473732 ; 30 ; 30 ; 430 ; 250 ; 10 ; ./f_2.gif
Tt B ; 1 ; ./m_07.txt ; 4 ; 1 ; Arial ; 8 ; 1277632 ; 500 ; 30 ; 130 ; 250
Tt 3 ; 2 ; ./tcht.txt ; 1 ; 0 ; Arial ; 10 ; 1260511 ; 30 ; 300 ; 600 ; 220 ; ; 0 ; 100
|
Data File Format
| Colum |
Nom |
Type |
Description |
| 1 |
Titre |
String |
File Title |
| 2 |
NumCol |
Ineger |
Number of column in data file |
| 3 |
DataFile |
String |
Data file URL |
| Part 1 |
|
* Parts 0 : with “title” title chart
title ; Test “tChart”
* Parts 1 : with “col” column informations
col ; Praxis ; 12632256
col ; Picpus ; 16711680
col ; Gerico ; 00065280
col ; Sigagip ; 00000255
col ; CASH ; 00065535
col-1 : always “col”
col-2 : column title (string)
col-3 : column color (int)
* Parts 2 : with “label” oX and oY label
label ; x Label ; y Label
|
| Part 2 |
|
* Parts 2 : Data
Janvier ; 10 ; 20 ; 15 ; 30 ; 30
Fevrier ; 15 ; 30 ; 20 ; 30 ; 25
col-1 : line title (string)
col-2 … col-n : values (int)
|
Historique
| 5.31 |
Correct a prb with all negatives values. |
| 5.30 |
add javascript function , mode point simple, and more… |
| 5.20 |
add tChart4, Rotate Texte,… |
| 5.00 |
JDK 1.1, mode point, … |
| 4.51 |
change default delimiter. |
| 4.50 |
add setUnit function, change bar presentation. |
| 4.30 |
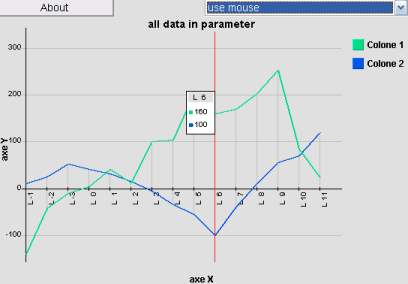
Change data file format (texte delimited), can get all data in param. |
| 4.20 |
Add Javascript setup, can change decimal format. |
| 4.15 |
Add a nan function,…. |
| 4.01 |
Correct a minor bug in set Min max,…. |
| 4.00 |
Add scalling support, add min-max option,…. |
| 3.52 |
Add “title” option and JavaScript support in tChart3. |
| 3.51 |
Correct a minor bug in refresh data. |
| 3.50 |
Add Horizontal Scroll. |
| 3.10 |
Add Area and SumArea support (type 5 and 6) and hide comment. |
| 3.00 |
Make component cChart, support 2 canvas in tChart. |
| 2.00 |
Add table display. Float support |
| 1.00 |
First version. |
Filed under: applet, java


Ajouter une réponse